MCB 32L is the first class I ever taught at UC Berkeley in fall 2012. I have taught it about 12 times since and it always goes well. Students enjoy doing experiments on themselves, like seeing their own ECGs and calculating their basal metabolic rate. I had no plans to change such a well functioning course, but I attended a three day workshop from the data science department about adding some data science into our courses. Data science is a new emphasis for UC Berkeley, and they are very enthusiastic about partnering with classes in a wide range of departments. I was convinced that some basic programming and data analysis skills should be part of the MCB curriculum. Since I have the most control over the courses I teach by myself, I decided to add data science to MCB 32L.
introduction to python for data analysis and graphing
We collect a lot of data in our course and ask students to make graphs by hand or in Excel, so all of that could be done using Python instead. Working with undergrads in the data science major, we developed Jupyter notebooks to introduce students to coding with Python. The physiology labs already existed, we just had students analyze the data and make graphs in the Jupyter notebooks.
- Lab 2: Sensory systems
Introduction to Python and some basic commands. Students make a two column table of reaction times and make a bar graph. - Lab 4: Muscle contractility
Introduction to line plots. - Lab 5: Electromyography
Linear regression to calibrate the force dynamometer, writing equations to apply across a table, generating scatter plots to see how EMG amplitude changes after muscle fatigue. - Lab 6: Frog heart
More bar graphs of student data, introduction to statistical tests (t-test). - Lab 8: Exercise physiology
Arithmetic across a table to calculate things like total peripheral resistance and cardiac output. - Lab 9: Diabetes data science
Machine learning (see below).
Machine learning and classification
We developed one new lab that relies completely on coding, which students have hopefully become comfortable with through the earlier labs. We use a diabetes patient data set and have students look at the different variables such as blood glucose levels, insulin levels, body mass index, and blood pressure. Which variables correlate well with diabetes? Based on those findings, students build a classifier for diabetes. In other words, they develop a model which can predict whether a patient has diabetes or not by looking at the most correlated variables.
Link to the Jupyter notebook for Lab 9. This is in pdf format, so you can’t actually write the code, but you get an idea of what the students need to do.
student response
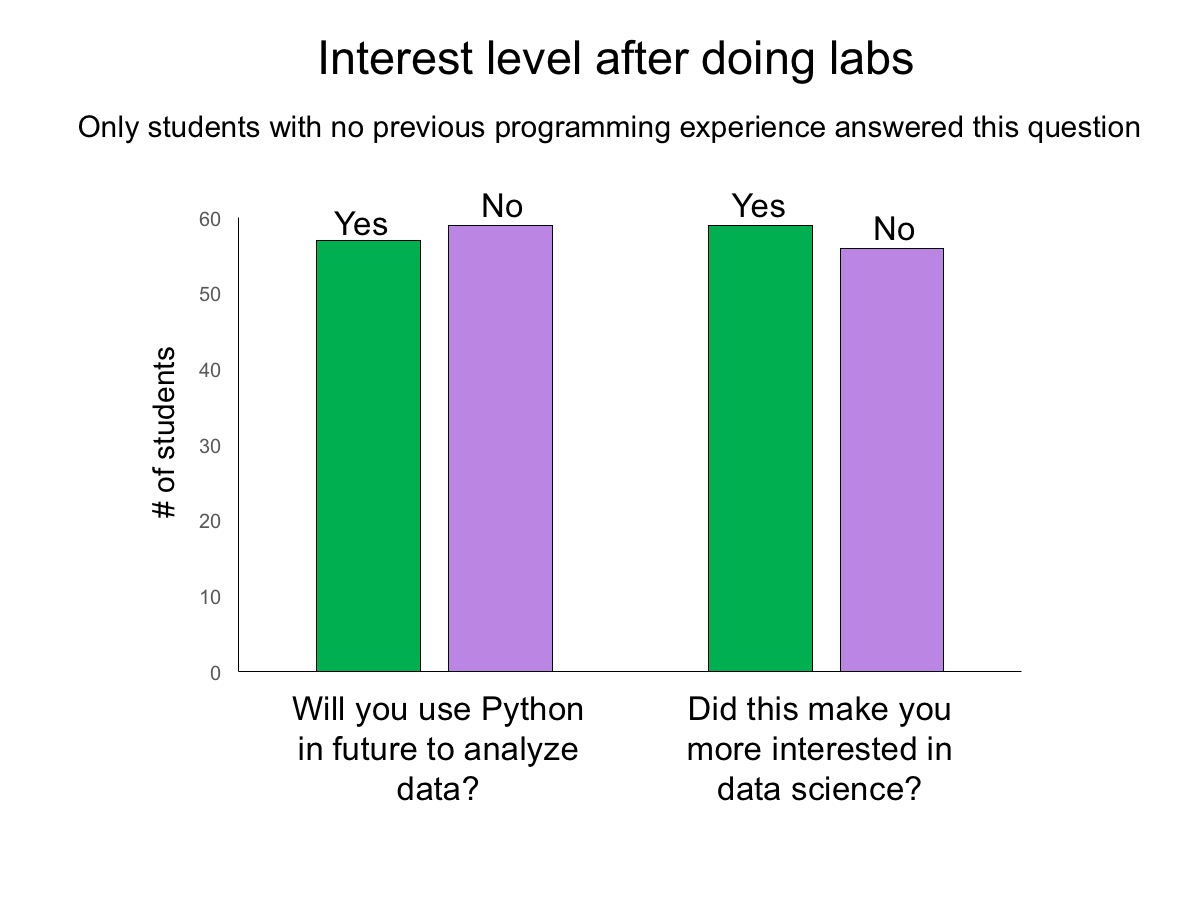
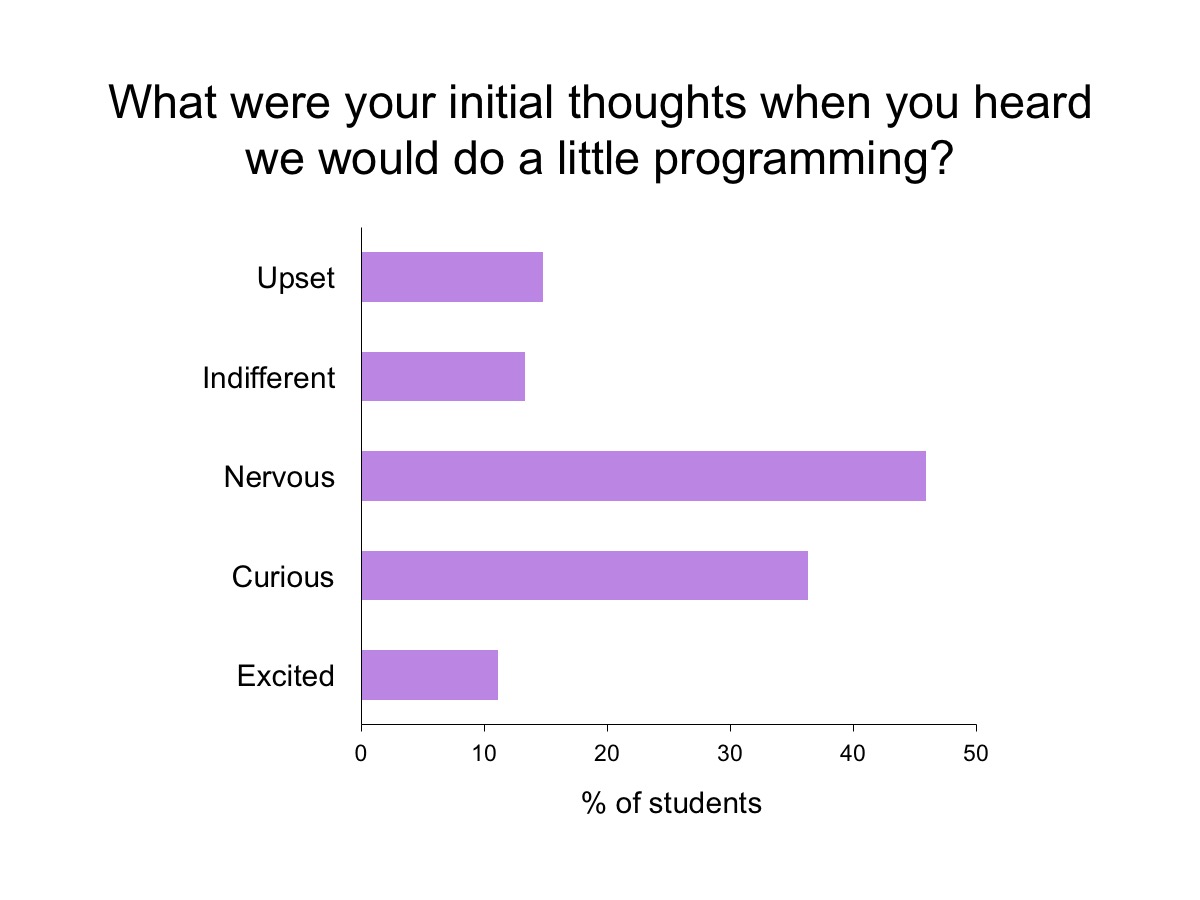
At the end of the semester I surveyed the students on their feelings about the data science component. In general, it was positive, but the few students who did not enjoy it, really disliked it. They were frustrated using Python and just gave up on learning it. Next semester we plan on doing more introduction to the programming language and I will introduce it better in class. Second time through should be much smoother.